Hotel Business Intelligence Analysis - Power BI Dashboard Project
Hotel Business Intelligence Analysis - Power BI Dashboard Project
Project Introduction
This project involved creating a comprehensive Business Intelligence dashboard for hotel management using Power BI. The assignment focused on transforming raw hotel data into actionable insights through data modeling, DAX calculations, and interactive visualizations.
Project Objectives
The purpose of the assignment was to gain hands-on practice:
- Understanding the Hotel business and client needs
- Load and transform the various datasets
- Build the Data Model using the star schema to build the underlying data model and the required relationships
- Duild Data Analysis Expression (DAX): Create new columns and measures using DAX expressions
- Dashboard: Create a compelling and interactive dashboard report from the analysis of the datasets that would speak clearly to the business needs for decision-making
Step-by-Step Implementation
Step 1: Understanding Hotel Business Requirements
I began by analyzing the hotel business domain to identify key performance indicators and decision-making needs. Through research on hotel operations, I identified critical metrics including revenue management, occupancy rates, seasonal trends, and customer booking patterns. This understanding shaped my approach to ensure the dashboard would address real business challenges such as optimizing room pricing, identifying peak seasons, and improving operational efficiency.
Step 2: Data Loading and Transformation
Using Power Query in Power BI, I loaded multiple datasets, including:
- Fact tables: Booking transactions and revenue data
- Dimension tables: Date, rooms, hotels, and customer information
The transformation process involved:
- Cleaning inconsistent date formats and standardizing values
- Handling missing data through appropriate imputation methods
- Creating calculated columns for stay duration and revenue categories
- Validating data integrity across all source files
Step 3: Building the Data Model with Star Schema
I implemented a star schema design with the fact_bookings table as the central fact table connected to dimension tables. This involved:
- Establishing proper relationships with one-to-many cardinality
- Configuring referential integrity to maintain data consistency
- Optimizing the model for query performance and usability
- Creating a logical structure that supports flexible analysis across multiple dimensions
Step 4: Developing DAX Measures and Calculations
I created comprehensive DAX expressions to calculate key business metrics:
- Revenue Analysis: Total revenue, average daily rate (ADR), RevPAR
- Occupancy Metrics: Occupancy rate, available room nights
- Time Intelligence: Year-over-year growth, moving averages, period comparisons
- Business KPIs: Cancellation rates, booking lead time, customer retention These measures transformed raw data into meaningful business intelligence that powers the dashboard’s insights.
Step 5: Creating Interactive Visualizations
I designed an intuitive dashboard with multiple interconnected visualizations:
- Revenue trend analysis with time-series charts.
- Room type utilization and performance comparisons.
- Seasonal booking pattern analysis.
- Interactive filters for date ranges, hotel properties, and room categories. The dashboard layout emphasizes usability while providing depth for analytical exploration.
Final Dashboard Visualization
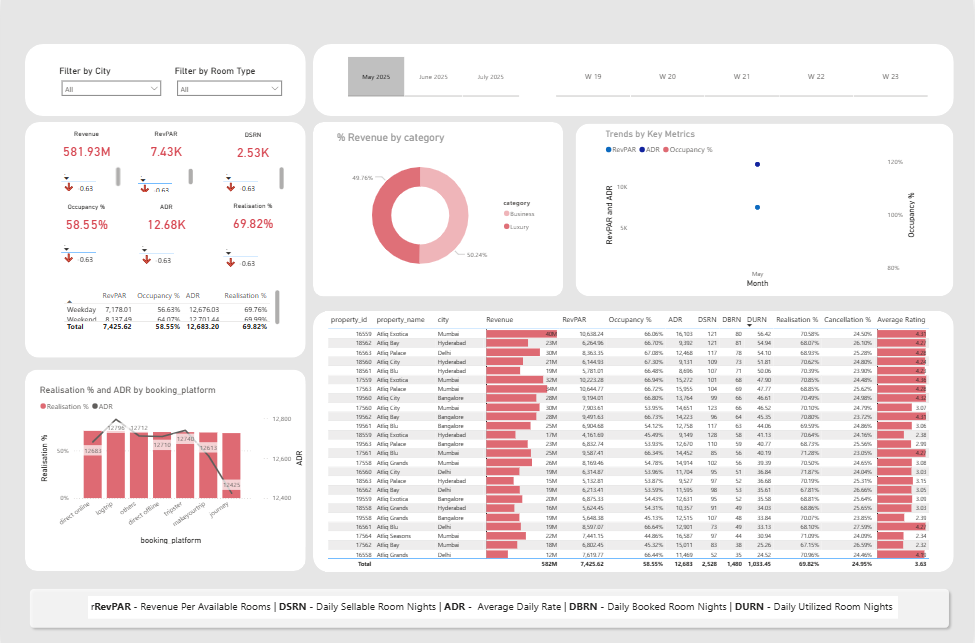 Complete interactive Power BI dashboard showing comprehensive hotel performance metrics, including revenue trends, occupancy rates, and geographic distribution
Key Lessons Learned
- Business Context is Crucial: Understanding hotel operations was essential for creating relevant metrics and visualizations that address real business needs.
- Data Modeling Impacts Performance: The star schema design significantly improved query performance and simplified measure creation, demonstrating the importance of proper data architecture.
- DAX Mastery Enables Advanced Analytics: Learning time intelligence functions and context manipulation in DAX opened up powerful analytical capabilities beyond basic calculations.
- User Experience Matters: Designing intuitive filters and interactive elements made the dashboard accessible to non-technical stakeholders while maintaining analytical depth.
- End-to-End BI Development: This project provided hands-on experience with the complete BI development lifecycle from data extraction to published dashboard.
Technical Achievements
- Successfully implemented a star schema data model, optimizing query performance.
- Utilized 15+ complex DAX measures for comprehensive business analysis.
- Created interactive visualizations with cross-filtering capabilities.
Business Impact
The dashboard enables hotel management to:
- Make data-driven pricing decisions based on demand patterns
- Optimize room inventory allocation across properties
- Identify seasonal trends and prepare for peak demand periods
- Track performance against historical benchmarks and targets
Project Resources
📊 Dashboard Visualization
📁 Project Files
Access Power BI Files on Google Drive
- Complete Power BI (.pbix) file
- Source datasets
- DAX expressions documentation
- Project report and analysis
Tools & Technologies Used
- Microsoft Power BI Desktop
- DAX (Data Analysis Expressions)
- Power Query
- Star Schema Data Modeling
This project was completed as part of my Business Intelligence portfolio assignment in Cyber Shujaa-Data and AI program, demonstrating end-to-end Power BI development capabilities.